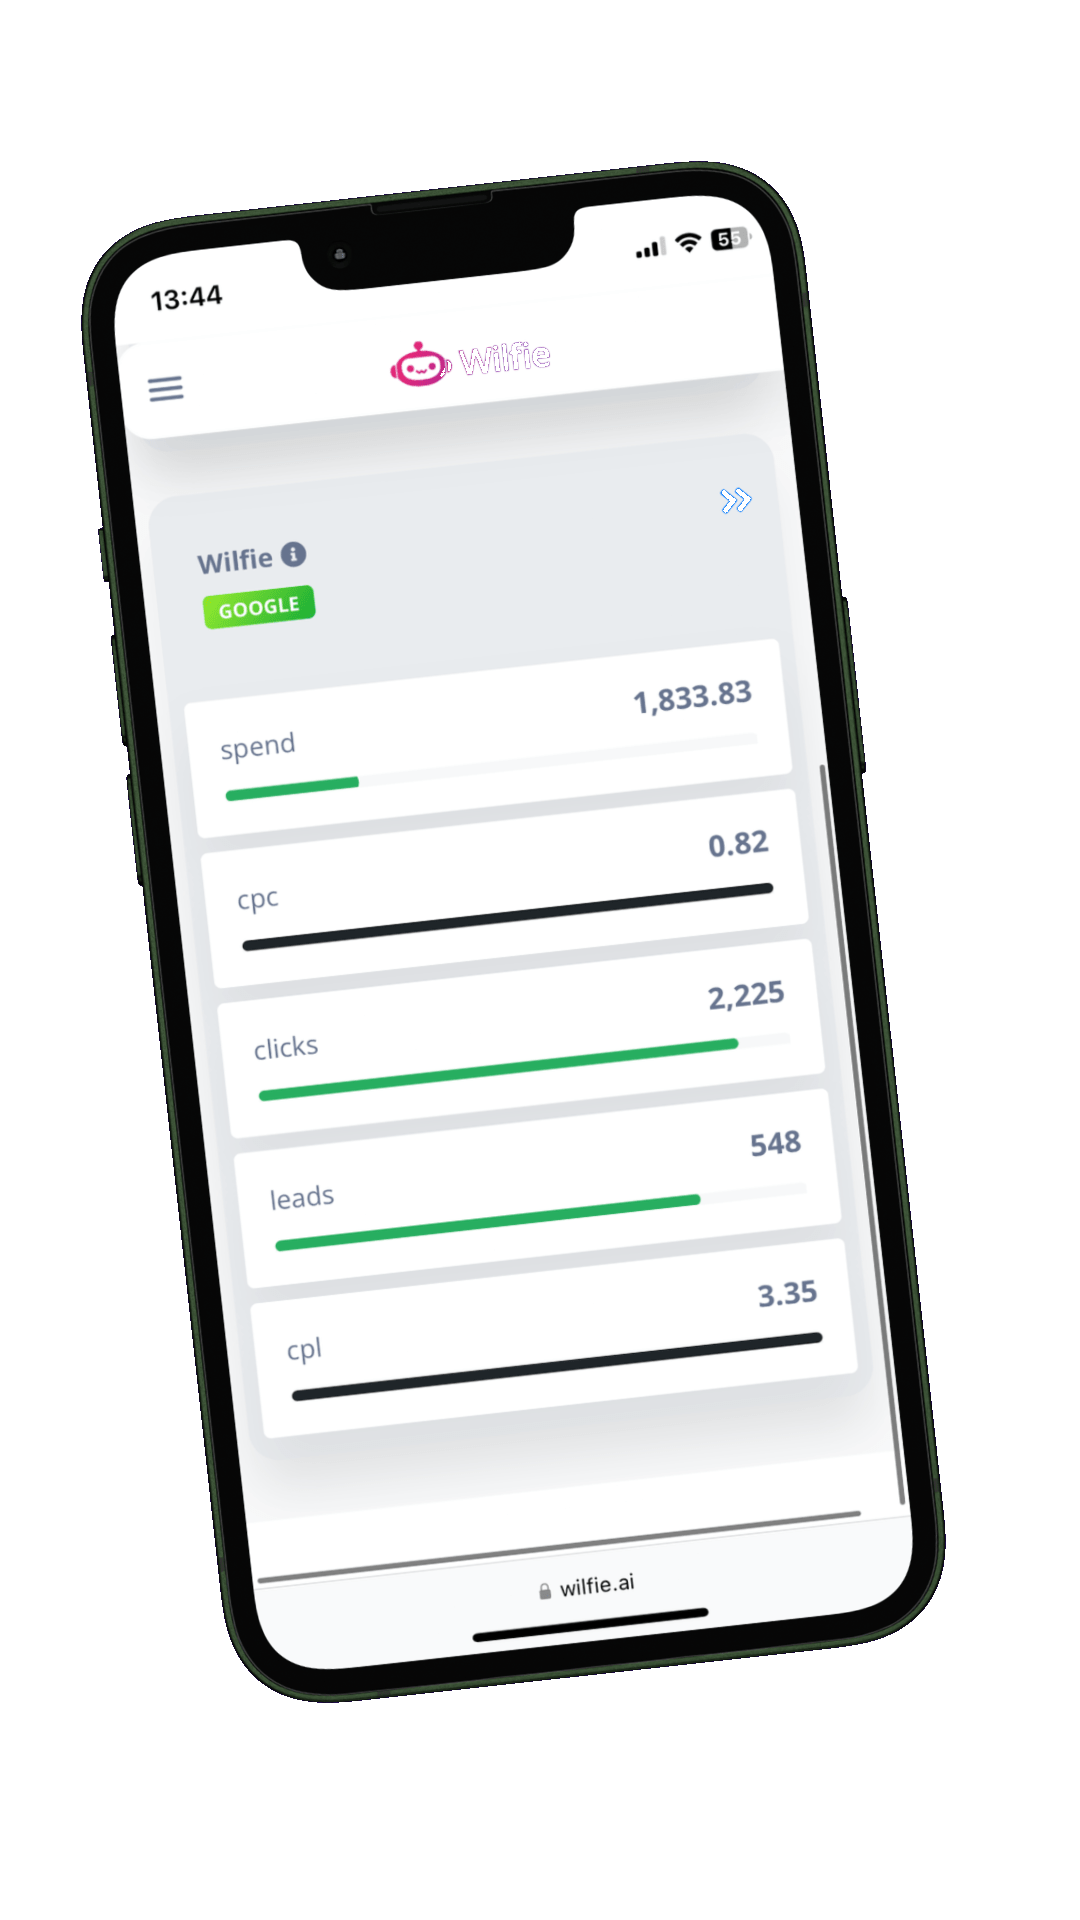
For business owners, it’s often hard to interpret statements like “Google visits were up 10% last week.” Is that significant? With our visual metrics, you’ll know instantly. See at a glance how your campaigns, metrics, and key performance indicators are performing. It is so simple to connect your data without any setup or configuration.
Beautifully Simple Metric Views – Try it now.

AI Metrics


Monitor all your Metrics in one glance with our unique metric view. Instantly see how each metric performs against the past 30 days, with true period comparisons, like 3pm today against up to 3pm in previous days. Effortlessly track revenue, leads, and more with progress indicators highlighting normal ranges. Stay on top of your metrics with ease!!
AI Metrics
What Can Simple Metrics Do for You?
Real-Time Metric Monitoring
Keep tabs on your business with metrics updated in real time. Understand how your key metrics—like spend, clicks, and leads—are performing without delay, giving you the confidence to act swiftly.
True Period Comparisons
Say goodbye to misleading data. Compare metrics like-for-like, ensuring you’re analyzing today’s progress against the exact same timeframe in past periods. No more apples-to-oranges comparisons.
Visual Insights at a Glance
Quickly assess performance with intuitive progress bars. See at a glance if a metric is in the green (top-performing), yellow, red (needs attention), or black (new record), helping you focus where it matters most.
What People Think
"This simple approach to Metrics has revolutionized how I manage my business data. The intuitive visuals and real-time comparisons mean I can instantly see what’s working and what needs attention. It's a game-changer!"
"As a Business Owner, tracking performance across multiple departments has never been this easy. These Simple visual metrics give me, clear, actionable insights without the hassle of digging through reports."
"I love how the Metrics simplifies data. The percentile-based progress bars make it so easy to understand performance at a glance. It’s like having a personal analytics assistant!"
Unlock the Power of Simple Metrics
Clear Visibility
Simple Metrics provides instant clarity by showing how your KPIs perform over time. Easily spot trends and outliers without the need for complicated reports or overwhelming data.
Accurate Comparisons
Experience true period comparisons. Compare today’s progress against the same timeframe from previous days, ensuring precise and actionable insights for your business.
Use Anytime, Anywhere
Monitor your business performance on any device, whether you’re at your desk or on the go. With Simple Metrics, your key data is always within reach, empowering informed decisions.


